Whistle Trends: Mapping Official Biases Across Football Leagues and NBA Conferences for Card and Foul Props
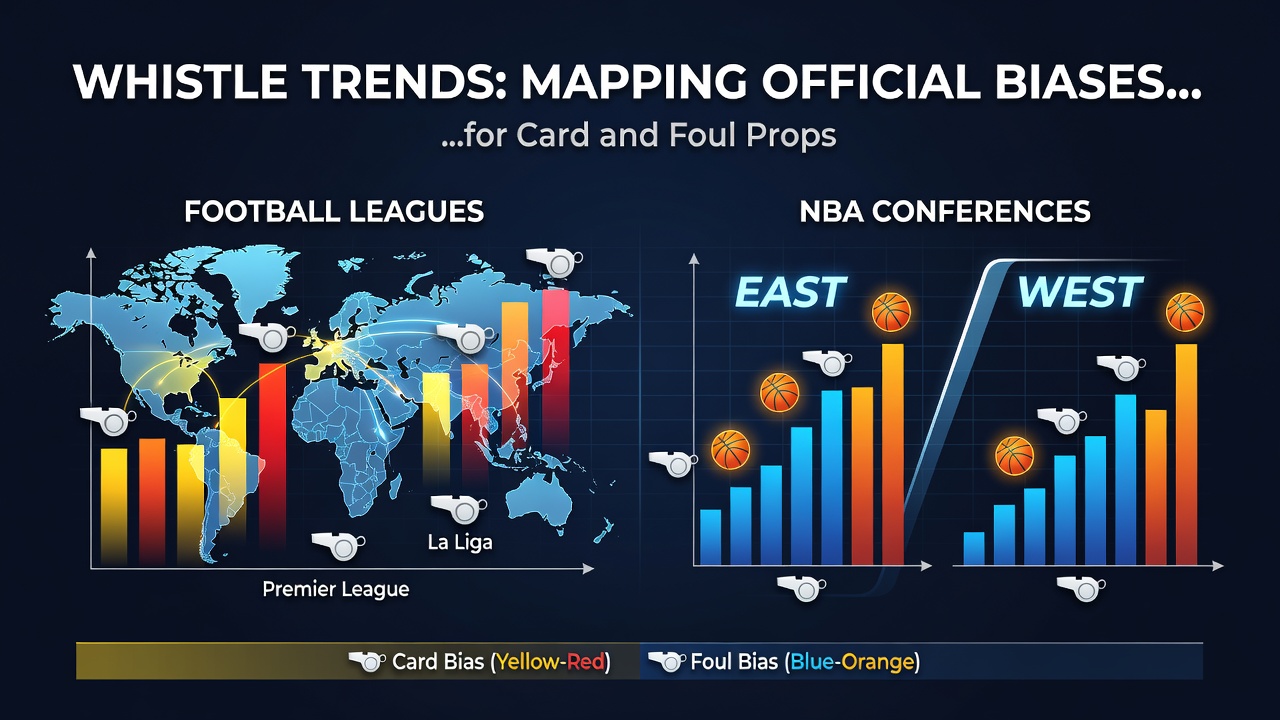
Referee tendencies create measurable patterns in card issuance and foul calls that span multiple football leagues along with NBA conferences, and these patterns shape outcomes for related betting props in structured ways. Data from the 2025-2026 season shows consistent variations in how officials from different regions and conferences handle physical play, while analysts track these differences through league-specific databases that record every whistle. Observers note that certain competitions reward stricter enforcement whereas others allow more contact before cards appear, and this distinction matters for anyone examining prop markets tied to yellow cards or total fouls.
Football League Patterns in Card Distribution
European domestic leagues display distinct profiles when officials reach for their pockets, with Serie A maintaining higher average card counts per match than the Bundesliga across the past three completed seasons. League tables compiled by tracking services reveal that Serie A referees issue 5.8 yellow cards on average per game compared with 4.2 in Bundesliga fixtures, and this gap persists even after adjustments for playing style and match importance. Meanwhile La Liga and the Premier League sit between these poles, each producing roughly 5.1 cards per contest according to aggregated match logs from the 2025-2026 campaign.
Home teams receive fewer cautions across all four major leagues, yet the margin widens noticeably in certain competitions. Serie A home sides avoid cards at a higher rate than their Bundesliga counterparts, and researchers attribute part of the difference to varying referee rotation policies that keep officials away from their home regions less frequently in Italy. Those who study these datasets point out that away teams in the Premier League draw cards at elevated rates during evening kickoffs, a trend visible in both weekday and weekend fixtures throughout the current season.
NBA Conference Differences in Foul Calls
Shifts appear when the focus moves to NBA conferences, where Eastern officials call slightly more fouls per game than their Western counterparts during the 2025-2026 regular season. Conference-level statistics compiled from official play-by-play feeds indicate an average of 21.4 fouls per Eastern Conference game versus 20.1 in Western Conference matchups, and the pattern holds across both regular season and playoff environments. Teams that rely on perimeter defense encounter more foul calls when playing in Eastern arenas, while interior-focused clubs experience steadier whistle rates regardless of conference.
Back-to-back scheduling influences these numbers further, as data shows increased foul calls in the second game of road back-to-backs within the Western Conference. League tracking records document this uptick across multiple months, and the effect appears strongest in games involving younger rosters still adjusting to travel demands. Analysts examining conference splits note that certain Western teams draw fewer shooting fouls on the road, a tendency that carries implications for foul prop markets tied to individual player totals.
Cross-Sport Mapping Techniques
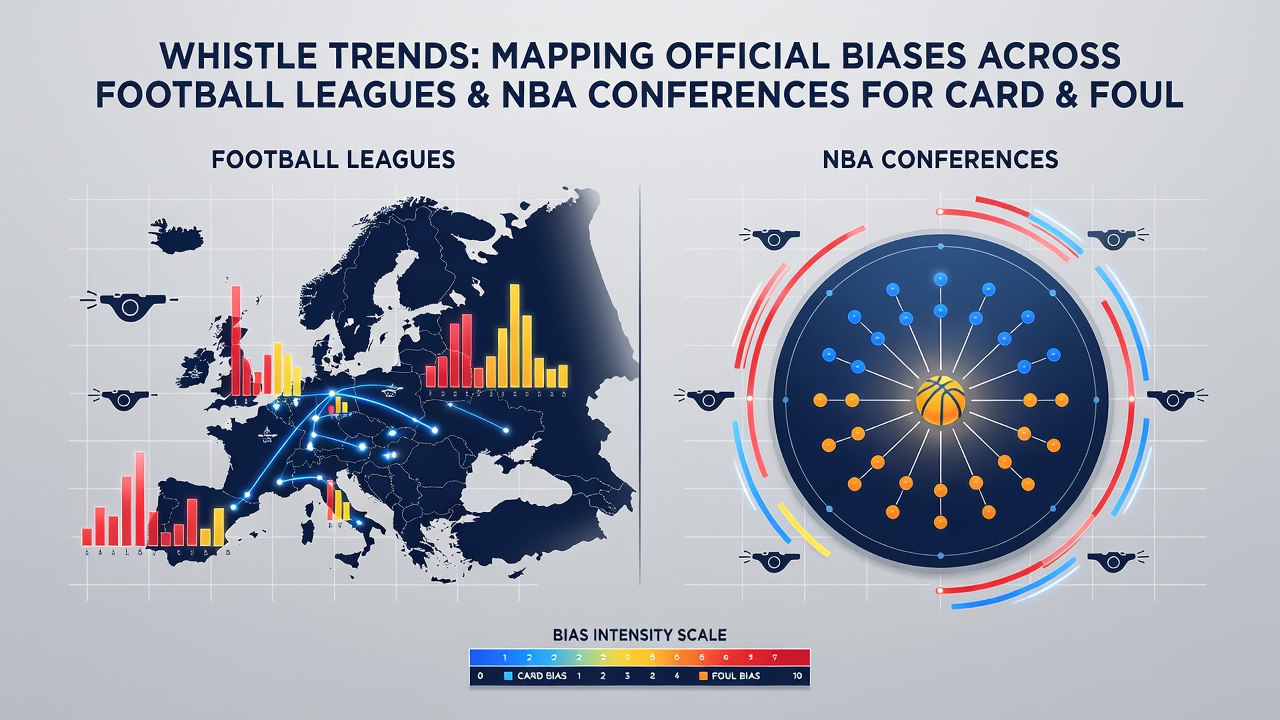
Mapping these biases requires combining referee-specific logs with venue and schedule variables, and several organizations now publish granular datasets that support such analysis. The Nevada Gaming Control Board releases quarterly summaries that include prop bet settlement rates for NBA foul markets, while a separate study from Monash University researchers examines card patterns across European football using automated video review metrics. Both sources allow comparisons that isolate officiating tendencies from team style, and the resulting maps highlight clusters of stricter enforcement in particular leagues and conferences.
Those examining the datasets often segment matches by time of season, because early-round fixtures in both football and basketball show different card and foul baselines than later rounds. Football leagues tighten enforcement after the winter break, whereas NBA conferences exhibit steadier foul rates once the all-star break concludes. The variations remain small in absolute terms yet compound across large sample sizes, which explains why prop bettors track these seasonal adjustments closely.
Implications for Prop Markets
Card props in football respond directly to the league-specific baselines outlined above, and similar logic applies to NBA foul props when conference splits enter the equation. Markets that list over/under cards for individual matches or player foul totals reflect these underlying patterns once oddsmakers incorporate the latest referee assignments and venue data. Historical settlement rates published by regulatory bodies confirm that certain combinations, such as Serie A away games or Eastern Conference back-to-backs, produce measurable deviations from league averages.
Referee rotation schedules add another layer because officials with documented tendencies appear in predictable windows. Tracking services now flag these assignments in advance, allowing cross-checks against historical card and foul averages for each league or conference. The resulting edges remain modest on a per-game basis, yet they accumulate when applied consistently across multiple fixtures within the same competition.
Conclusion
Official biases in card and foul issuance follow identifiable patterns across football leagues and NBA conferences, and these patterns appear in season-long datasets maintained by regulatory agencies and academic researchers alike. Mapping efforts that combine referee logs with schedule and venue variables produce clearer baselines for both sports, and the resulting information supports more precise evaluation of related prop markets. Continued collection of granular play-by-play data will likely refine these maps further as additional seasons unfold.