Schedule Congestion Patterns Reshaping Efficiency Metrics in International Soccer and NBA Campaigns
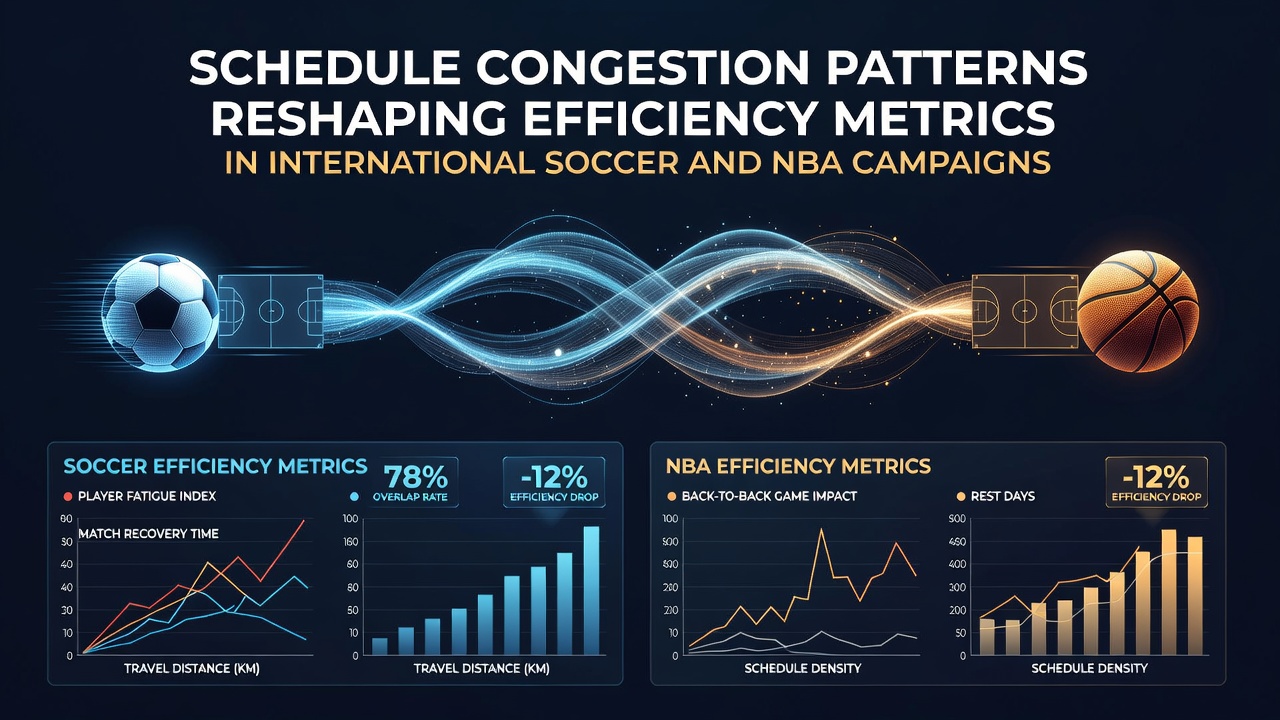
Schedule congestion has emerged as a defining factor in how teams measure and maintain performance across international soccer and NBA seasons, with packed calendars forcing adjustments in training loads, recovery protocols, and statistical tracking. Researchers tracking fixture density note that overlaps between domestic leagues, continental competitions, and national team windows create measurable drops in key efficiency indicators such as points per possession in basketball and pass completion rates under fatigue in soccer.
Data from recent campaigns shows that teams facing multiple games within short windows experience shifts in output, while those with better spacing maintain steadier production. Observers tracking both sports point to patterns where back-to-back obligations coincide with declines in defensive efficiency metrics, particularly when travel distances exceed typical recovery thresholds.
Fixture Overlaps in International Soccer
International soccer calendars pack club commitments alongside FIFA windows, and this density alters how analysts calculate player workload and team output. During periods leading into June 2026, when qualifiers and club playoffs converge, squads often play three matches in eight days, a pattern that correlates with reduced sprint distances and lower expected goal values according to performance databases maintained by European leagues. Those studying these sequences report that midfielders logging high minutes across competitions post lower tackle success percentages, while forward lines convert fewer high-quality chances as fatigue accumulates.
Coaches adjust rotations accordingly, and data indicates that clubs rotating six or more players across congested stretches preserve higher team possession retention rates compared with sides relying on fixed lineups. Studies from sports science groups in Australia and Canada have quantified these effects, showing that recovery intervals shorter than 72 hours link directly to elevated muscle strain reports and measurable dips in aerobic capacity scores.
NBA Schedule Density and Performance Indicators
The NBA regular season stretches across 82 games with frequent back-to-backs and three-in-four-night sequences, reshaping how efficiency metrics like effective field goal percentage and defensive rating are interpreted. League tracking systems record that teams on the second night of back-to-backs average lower transition scoring rates, while road squads traveling across time zones post steeper drops in rebounding efficiency during the latter stages of road trips. Analysts reviewing 2025-2026 season figures note these patterns intensify around the all-star break and into the spring playoff push.
Front offices now incorporate congestion-adjusted models when projecting player availability, and evidence from league injury surveillance programs reveals higher soft-tissue issue rates following stretches with limited rest. Teams that employ load-management protocols, resting key contributors during low-stakes windows, demonstrate steadier offensive rating maintenance across the full campaign compared with squads maintaining rigid rotations.
Cross-Sport Comparisons of Efficiency Shifts
Patterns observed in both sports reveal shared responses to fixture compression, though the measurement tools differ. Soccer metrics emphasize distance covered per 90 minutes and pressing intensity, whereas NBA analytics focus on pace-adjusted scoring margins and usage rates under fatigue. Research compiled by academic institutions across North America and Europe indicates that both codes see parallel declines in decision-making speed after repeated high-intensity exposures without adequate recovery blocks.
One longitudinal review of elite athletes found that soccer players in European leagues and NBA athletes exhibit similar drops in reaction time metrics when cumulative travel exceeds 10,000 kilometers within a four-week window. These findings have prompted governing bodies to explore calendar reforms ahead of major 2026 events, including potential adjustments to international windows that overlap with domestic finales.
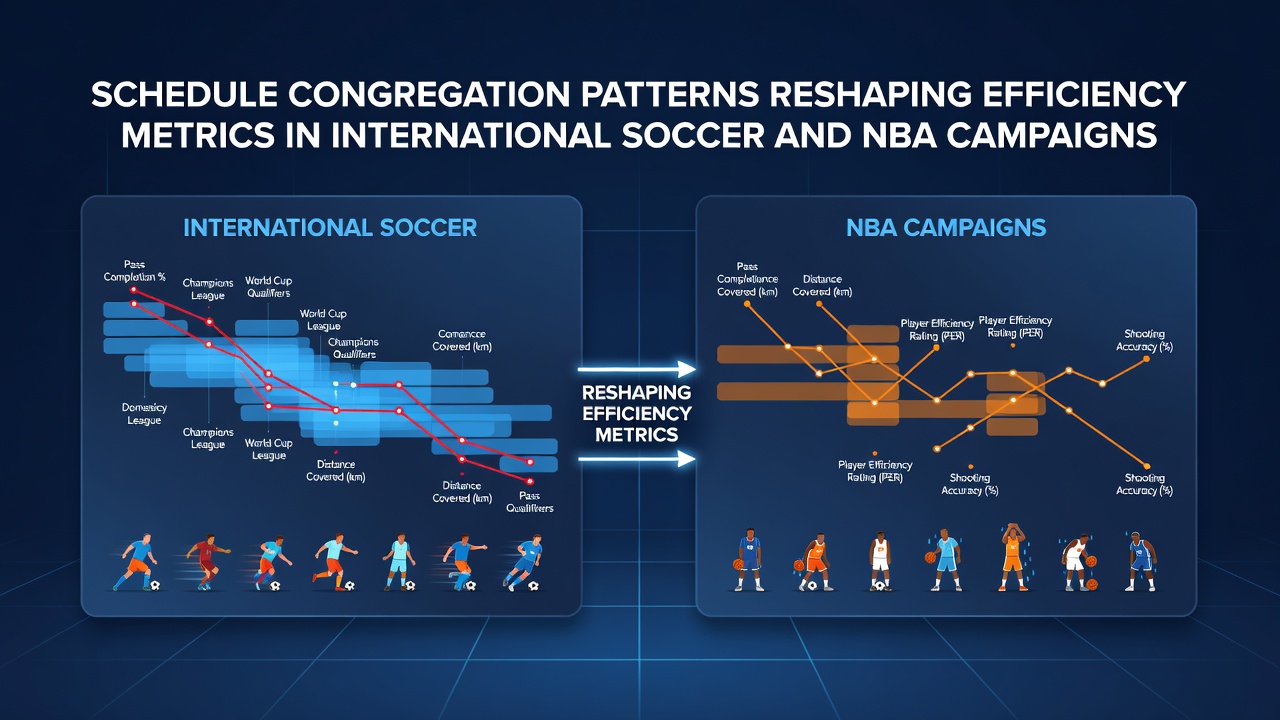
What's notable is how these adjustments appear in publicly available box scores and tracking data, allowing performance analysts to isolate congestion effects from other variables such as opponent strength or venue conditions. Teams that integrate real-time biometric monitoring report better preservation of key outputs, including higher successful pass percentages in soccer and improved assist-to-turnover ratios in basketball during dense periods.
Data Sources Informing Calendar Adjustments
Organizations including the Australian Institute of Sport and the European College of Sport Science have contributed datasets that quantify how schedule density influences injury incidence and performance sustainability. These resources help federations model future calendars, and figures released ahead of the 2026 cycle show increased attention to recovery windows between continental and national obligations. NBA statistical repositories similarly provide granular travel and rest data that front offices cross-reference when constructing season-long strategies.
Observers reviewing these combined datasets note that efficiency metrics no longer reflect raw talent alone but incorporate the cumulative impact of fixture lists, prompting leagues to publish congestion indices alongside traditional standings. This transparency allows stakeholders to anticipate periods where output variance rises and to plan accordingly.
Conclusion
Schedule congestion continues to reshape how efficiency metrics are calculated and interpreted across international soccer and NBA campaigns, with data revealing consistent patterns of output variation tied to fixture density and recovery availability. As calendars evolve toward 2026, leagues and performance teams rely on expanded tracking systems to isolate these effects and to implement targeted interventions that stabilize key indicators throughout extended seasons.