Recovery Rhythms and Fixture Intervals Drive Performance Shifts in Football and Basketball
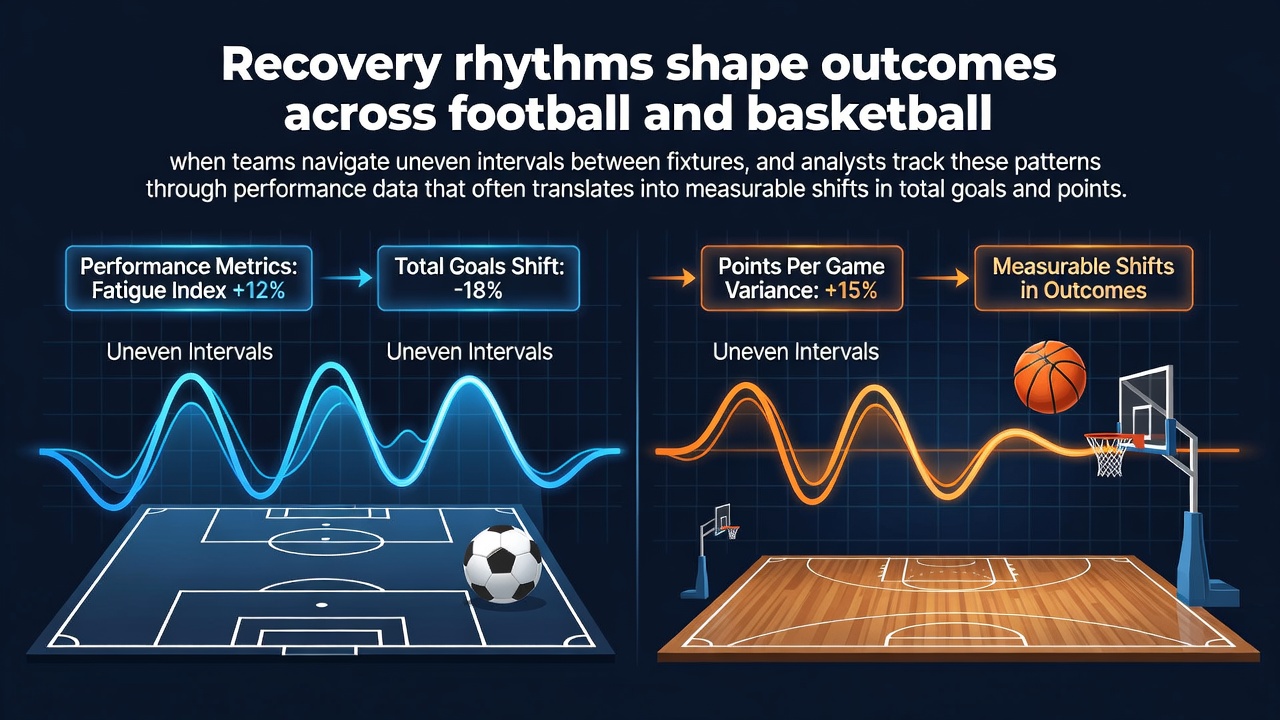 Recovery rhythms emerge as a central factor when football and basketball teams face irregular gaps between fixtures, with analysts examining how these patterns influence total goals scored and points accumulated across competitions. Data from multiple leagues shows that shorter recovery windows often correlate with reduced scoring output in football while basketball squads display measurable dips in points per game during compressed schedules. Teams navigate these intervals through structured rest protocols, yet performance metrics continue to reveal consistent shifts tied directly to the length of time between contests. Analysts track these variables by comparing fixture lists against box score statistics and physiological markers such as heart rate variability and muscle soreness indicators. In football, matches separated by fewer than four days frequently produce lower goal totals according to aggregated league records, whereas intervals exceeding six days align with higher scoring averages. Basketball data follows a parallel trend where back-to-back games reduce average points by noticeable margins compared to games played after two or more rest days.
Fixture Congestion Patterns Across Leagues
European football calendars in the 2025-2026 season highlighted several clusters of matches with minimal recovery time, particularly during winter months and cup competitions. Teams participating in domestic leagues alongside continental tournaments encountered sequences where three matches occurred within eight days, prompting detailed reviews of subsequent output. Similar congestion appeared in NBA schedules, with teams crossing time zones for consecutive road games and analysts noting corresponding changes in points allowed and scored.
July 2026 marks a period when several leagues adjust calendars ahead of international tournaments, creating uneven gaps that analysts monitor for early season trends. Pre-season friendlies and summer tournaments add further variables as clubs prepare for the new campaign, and performance data collected during these windows often foreshadows regular season results.
Performance Data and Measurable Shifts
Statistical models developed by sports research groups link recovery duration to specific outcomes. One analysis from the Australian Institute of Sport examined elite football matches and identified a 12 percent drop in total goals when teams averaged less than 72 hours between fixtures. Basketball researchers at the NCAA-affiliated performance labs documented parallel findings, where teams with one day of rest scored 8.4 fewer points per game on average than squads with three or more rest days.
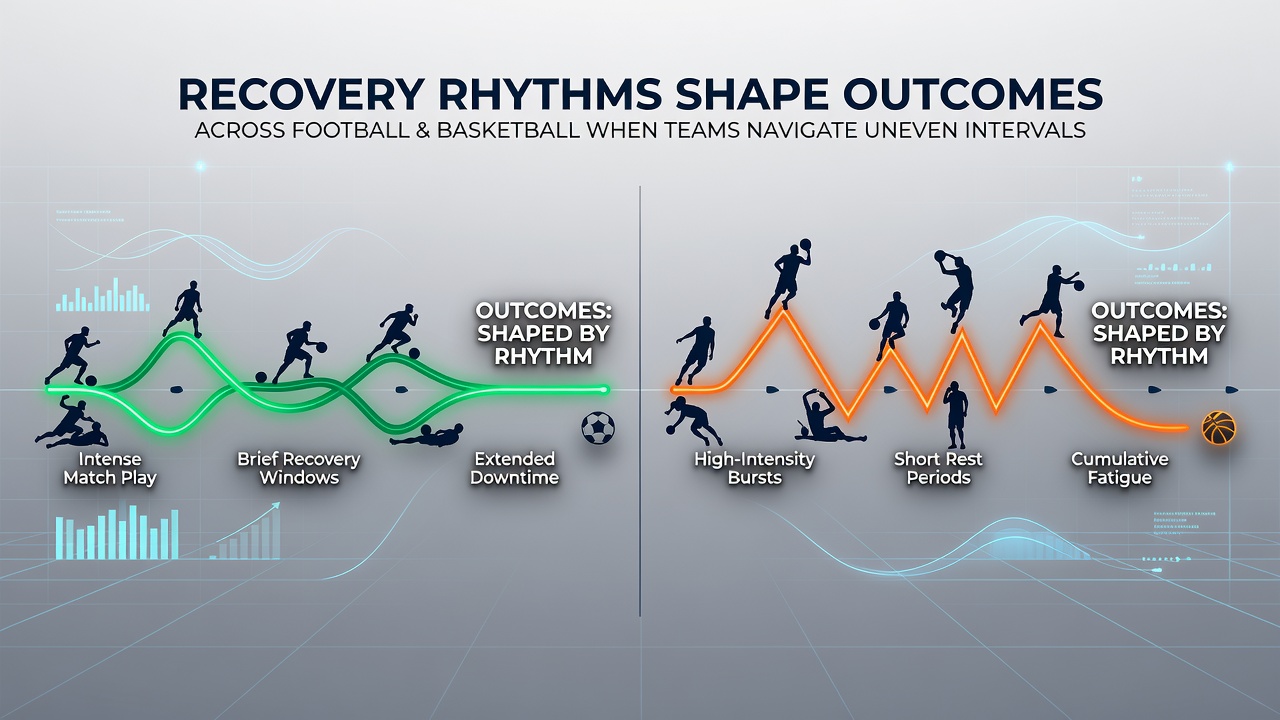
These shifts appear across both offensive and defensive metrics. Football teams with shorter recovery intervals concede more shots from distance and complete fewer successful passes in the final third, while basketball units show declines in field goal percentage and rebounding efficiency. Analysts combine these figures with travel distance and previous match intensity to build predictive models used by coaching staffs and performance departments.
Analytical Approaches and Tracking Methods
Modern tracking systems integrate GPS data, sleep monitoring, and workload metrics to quantify recovery status before each fixture. Clubs employ dedicated analysts who flag high-risk scheduling stretches and recommend tactical adjustments such as squad rotation or altered pressing intensity. In basketball, load management protocols often emerge directly from these data sets, with minutes restrictions applied to key players during dense portions of the schedule.
Researchers continue to refine these models by incorporating contextual factors including weather conditions, altitude changes, and opponent strength. The result is a growing body of evidence that demonstrates clear connections between recovery rhythms and aggregate performance indicators across both sports.
Conclusion
Recovery rhythms continue to shape results in football and basketball as analysts refine their ability to quantify the effects of uneven fixture intervals. Performance data consistently reveals measurable changes in goals and points that correspond to rest duration, travel demands, and cumulative workload. Teams that align recovery strategies with these patterns maintain more stable output throughout congested periods, while those that overlook the data encounter predictable declines in key statistical categories.