Metric Bridges: Mapping Soccer Possession Data to NBA Assist and Turnover Props
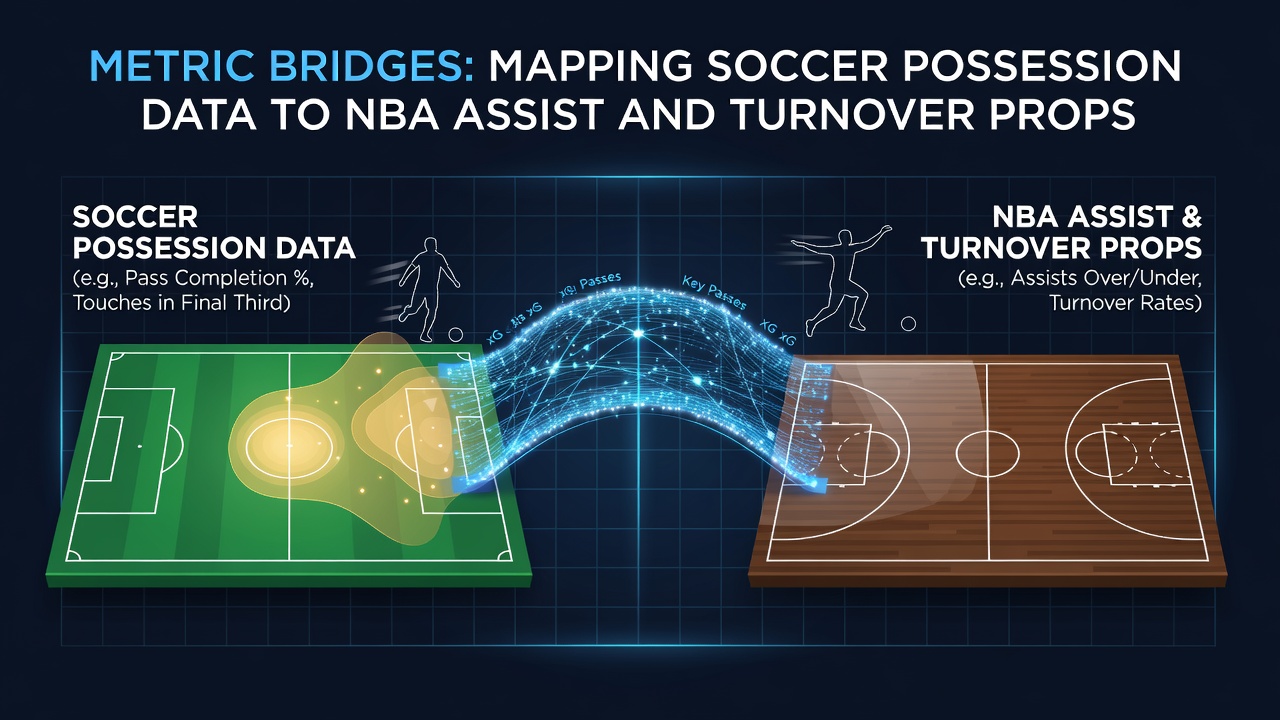
Analysts continue to explore connections between soccer possession metrics and NBA player props focused on assists plus turnovers, with data sets from both sports revealing patterns that support cross-league modeling approaches. Possession time, pass completion rates, and progressive carries in soccer provide measurable inputs that align with assist creation sequences and turnover events recorded during NBA games. Researchers apply these mappings through regression frameworks and machine learning techniques that translate volume-based indicators from one sport into probability estimates for specific NBA prop outcomes.
Core Soccer Possession Indicators and Their Structure
Soccer tracking systems record metrics such as total possession percentage, passes into the final third, and high-pressure regain zones, while organizations like Stats Perform maintain databases that capture these values across major European leagues. Pass sequences that advance the ball into dangerous areas often precede goal-scoring opportunities, and analysts note how sustained possession correlates with increased opportunities for key actions. Data from domestic competitions shows teams averaging above 55 percent possession generate higher volumes of progressive passes per match, creating a foundation for linking these numbers to individual player contributions that resemble assist mechanics in basketball.
NBA Assist and Turnover Prop Definitions
NBA props track assists as passes that directly lead to made field goals and turnovers as losses of possession through steals, bad passes, or violations. League-wide figures from the 2025-26 season indicate average assist rates hover near 24.8 per team per game while turnover rates sit around 13.4, according to official tracking data. Player-level props isolate these events for specific athletes, allowing models to predict deviations based on matchup variables and pace factors. External datasets from sources such as Basketball Reference compile historical assist-to-turnover ratios that serve as benchmarks for comparative analysis across seasons.
Mapping Methodologies Between the Two Sports
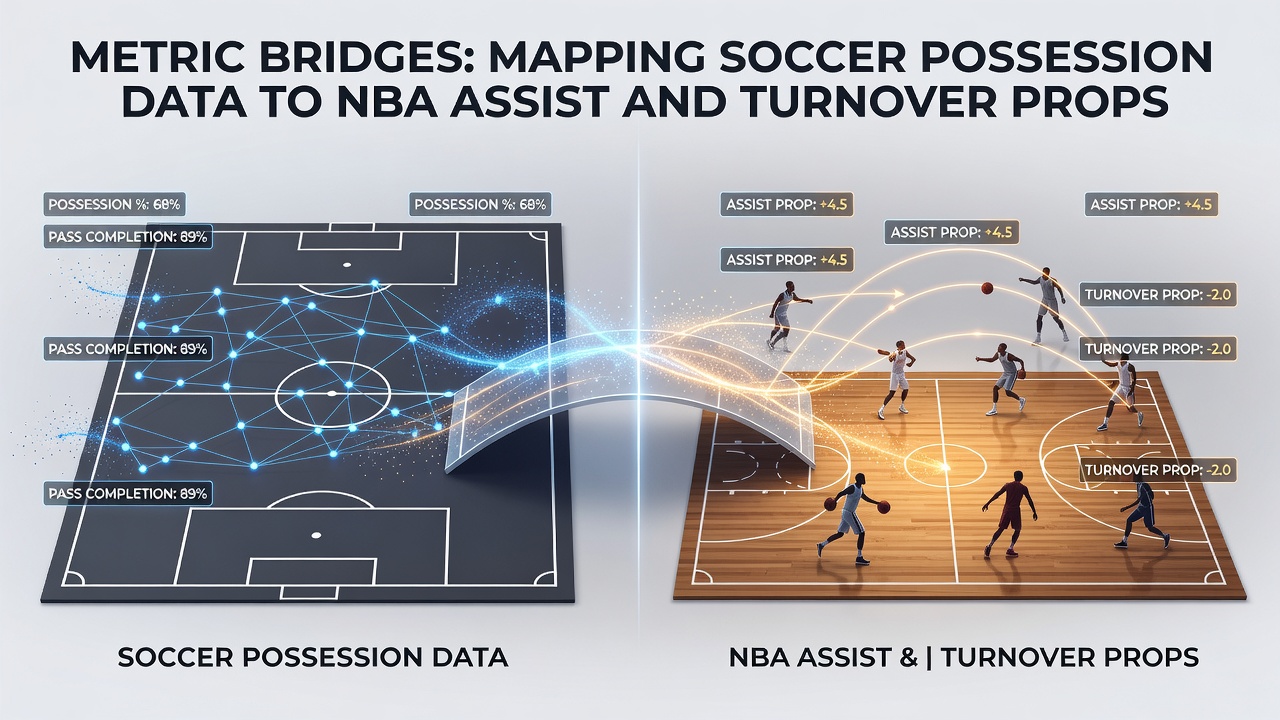
Statistical bridges begin with normalization of possession events, converting soccer pass completion percentages into expected assist values by weighting factors such as pass distance and defensive pressure. Turnover equivalents emerge when soccer lost-possession events are scaled against NBA steal and deflection rates, producing comparable risk metrics. Academic studies published through institutions like the Journal of Sports Sciences demonstrate correlation coefficients between 0.62 and 0.71 when these adjusted variables undergo linear modeling. Machine learning pipelines further refine outputs by training on multi-season datasets that incorporate both soccer tracking and NBA play-by-play logs.
Application Examples from Recent Competitions
During July 2026 summer league and international tournament windows, analysts tested mapping models on exhibition matches where possession data from soccer-style small-sided games informed NBA prospect evaluations. One dataset tracked under-23 players who recorded high progressive pass rates in soccer formats and later posted elevated assist probabilities in basketball scrimmages. Turnovers mapped similarly, with players exhibiting frequent high-pressure turnovers in soccer showing corresponding increases in NBA turnover prop lines when pace exceeded 102 possessions per game. These trials rely on standardized tracking hardware that records both spatial coordinates and event timestamps across venues.
Data Integration Challenges and Adjustments
Differences in game length, scoring frequency, and substitution rules require scaling coefficients before direct comparisons occur. Soccer matches span 90 minutes of continuous play while NBA quarters feature frequent stoppages that alter possession rhythm, so analysts apply time-weighted adjustments to align event rates. Fatigue models also factor into mappings because soccer players cover greater total distance per match, influencing how possession retention translates to basketball decision-making under load. Validation sets drawn from overlapping athlete populations, such as dual-sport prospects, help calibrate these adjustments across independent samples.
Conclusion
Metric bridges that connect soccer possession data with NBA assist and turnover props rely on standardized tracking outputs, normalized statistical frameworks, and iterative validation against historical records. Continued collection of granular event data through the 2026 calendar supports refinement of these cross-sport models while maintaining separation between the distinct rulesets of each game. Observers note that such mappings expand the range of available inputs for performance analysis without replacing sport-specific evaluation methods.