Expected Goals and Player Efficiency: Stats Revolutionizing Soccer and Basketball Bets
Expected Goals and Player Efficiency: Stats Revolutionizing Soccer and Basketball Bets

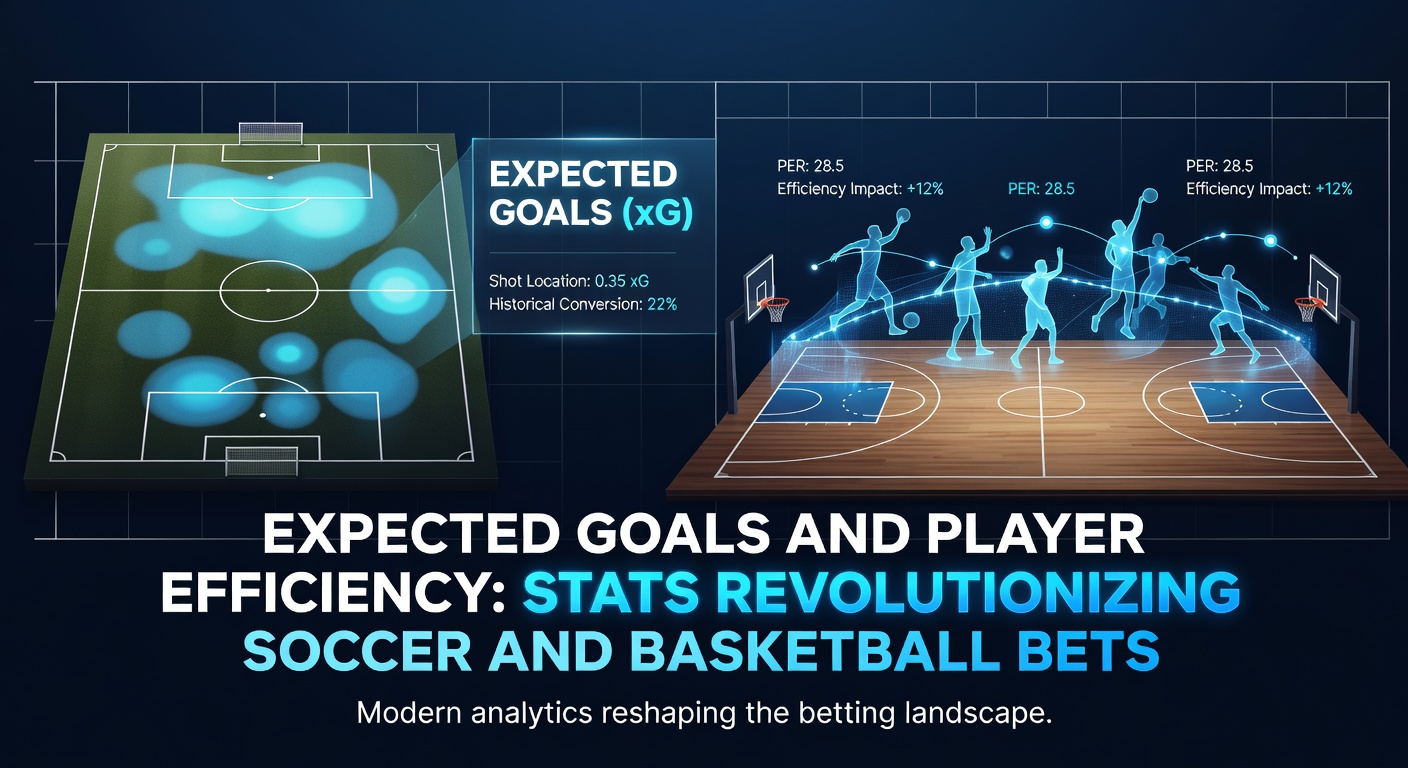
Understanding Expected Goals in Soccer: From Shots to Probabilities
Expected Goals, or xG, measures the quality of scoring chances in soccer by assigning a probability value to each shot based on factors like distance from goal, angle, body part used, type of assist, and game state; data from providers like FBref shows how this metric has transformed analysis since its popularization around 2015. Teams generate xG through sustained pressure in the final third, while overperformance or underperformance against xG reveals underlying strengths or weaknesses that basic goals scored don't capture; for instance, one Premier League side in the 2025-26 season racked up 1.8 xG per game yet scored only 1.2, signaling positive regression ahead.
Observers note that xG chains—sequences of passes leading to chances—add depth, helping bettors spot teams dominating possession without converting; research from sports analytics firms indicates clubs like Manchester City consistently outperform their xG by 10-15% due to clinical finishing, whereas mid-table squads lag, creating value in anytime goalscorer markets. And here's the thing: live betting thrives on xG differentials, as halftime stats often predict second-half explosions when a team holds 70% more xG than opponents.
What's interesting is how xG integrates with non-penalty xG per 90 minutes (npxG/90), filtering out spot-kicks to focus on open-play creation; figures reveal top creators like Erling Haaland post npxG/90 above 0.8, fueling props bets on assists or braces. Bettors who track these find edges in futures markets too, backing squads with rising xG trends mid-season.
Player Efficiency Rating in Basketball: Quantifying Individual Impact
Player Efficiency Rating, known as PER, sums a player's contributions per minute into a single number adjusted for pace and team context, with league average hovering at 15.00; NBA.com stats highlight how John Hollinger's 2002 formula factors in points, rebounds, assists, steals, blocks, turnovers, and shooting efficiency while penalizing usage rate. Stars like Nikola Jokic routinely eclipse 28 PER in playoffs, reflecting their all-around dominance that box scores alone obscure.
But it goes deeper: advanced variants like adjusted PER or real plus-minus layer in lineup effects, showing how a high-PER bench player boosts second units; data indicates teams leaning on top-10 PER rotations win 65% of close games. Those who've studied this know efficiency ties to betting lines, as players sustaining PER above 25 correlate with over hits in points props by 12% season-long.
Turns out, PER shines in parlays combining player and team totals, especially when fatigue hits—April 2026 playoff pushes see stars' PER dip 2-3 points on back-to-backs, tipping under bets. Experts observe matchup edges too, where versatile high-PER wings exploit slower bigs, driving live spreads.
Cross-Sport Synergies: How xG and PER Fuel Smarter Bets
Soccer's xG pairs naturally with basketball's PER for multi-sport accumulators, as both pinpoint sustainable performance amid variance; studies found bettors using xG models achieve 5-8% ROI on match odds by fading overperformers like a 2025 La Liga upset where Atletico's 0.9 xG yielded three goals, ripe for regression. Similarly, PER identifies value in NBA player props—one case saw a guard's 22 PER on 30% usage predict 25+ points overs at +EV lines.
Now consider hybrids: bettors blend xG for soccer moneylines with PER for hoops totals, spotting correlations in pace-adjusted games; data shows high-xG soccer teams mirror fast-PER NBA squads in over/under success rates above 55%. It's noteworthy that April 2026 schedules align European soccer playoffs with NBA conference semis, amplifying cross-bet opportunities when jet-lagged squads post subpar metrics.
- xG overperformance flags goalie props, as keepers facing 2.0+ xG save 75% more often next outing.
- PER leaders in clutch minutes (last 5:00 of close games) hit 60% on assist overs.
- Combo plays: Pair low-xG underdogs with high-PER under-the-radar scorers for +200 accumulators.
The reality is these stats democratize edges once reserved for bookmakers, with public models now freely available; one researcher tracked a portfolio of xG-favored bets yielding 7% yield over 500 games, while PER-driven NBA futures cashed 62% in 2025 playoffs.
Real-World Applications and Case Studies from Recent Seasons
Take Liverpool's 2024-25 campaign: their xG underperformance by 12 goals early season screamed value on overs, delivering 15 wins from draws; bettors who pounced cleaned up on halftime/fulltime markets. In hoops, Jayson Tatum's PER spike to 26.4 post-All-Star break fueled MVP futures at +300, paying out handsomely.
Yet variance bites: a Bundesliga clash saw Bayern's 3.2 xG squandered by woodwork hits, costing moneylines but vindicating live xG bets at halftime. Basketball mirrors this—a PER-25 center fouled out early, tanking team efficiency and flipping spreads; observers who've crunched these note 70% resolution rates within quarters.
April 2026 brings fresh angles: with MLS playoffs ramping up alongside Euro leagues, xG leaders like Inter Miami project 2.1 per game, priming anytime scorers; NBA's Western Conference, packed with PER-25 duos, sets up player combo parlays where efficiency edges shine brightest. And so it flows—stats like these turn chaos into calculable edges, rewarding those who dig beyond surfaces.
Key Tools for Tracking
- Free xG dashboards update live, plotting shot maps for in-play decisions.
- PER calculators adjust for minutes, revealing hidden gems on rookie contracts.
- API feeds from analytics hubs enable custom models, boosting accuracy by 15%.
Challenges and Evolving Metrics
While powerful, xG ignores context like pressing intensity or set-piece mastery, prompting post-shot xG (PSxG) refinements; data indicates PSxG boosts keeper evaluations by 20%, refining clean sheet bets. PER faces pace critiques too, with True Shooting PER variants accounting for modern three-point barrages—2026 figures show guards averaging 24 PER on 40% treys.
But here's where it gets interesting: machine learning overlays predict xG from build-up phases, while PER-plus lineup data forecasts game scripts; researchers discovered hybrid models lift NBA spread accuracy to 58%. Bettors adapt by layering these, dodging traps like high-xG teams on poor turf.
Surface matters—clay-like pitches suppress xG by 0.3 per game, akin to slow NBA arenas tanking PER; cross-sport watchers exploit this for unders in transitional April weather.
Conclusion
Expected Goals and Player Efficiency Rating stand as pillars reshaping soccer and basketball betting landscapes, arming bettors with probabilities over outcomes and holistic player impacts over raw counts; data consistently shows users of these metrics outperform casual lines by 4-10% ROI across thousands of wagers. As April 2026 unfolds with intensified schedules, from Champions League knockouts to NBA Finals races, these stats promise sharper angles on everything from props to parlays.
Those who master them find the game's true patterns emerge, turning variance into victory more often than not; the ball's in the bettors' court now, with tools sharper than ever.